Monday, January 27, 2025

Top of the Charts


For the past 10 years, the Gender Census has collected useful information about nonbinary people.

Across a decade, the results of the Gender Census have been remarkably consistent. 


All 11 identity terms chosen by at least 20 percent of respondents, at any point since 2015, remain above 20 percent today.

Therefore, if you learn the most common nonbinary identities, that knowledge will continue to be relevant in subsequent years.

Once you know the most common terms, you won’t have to regularly learn an entirely new lexicon to stay up to date.


The Gender Census is an annual global online survey of people who have a gender that isn’t strictly male or female.

This article is part of Season 3 of LGBT by the Numbers, a series that examines statistics about LGBT people in the US, and around the world. 


I wrote an article introducing Season 3, and explored the results of the 2024 Gender Census.

The first Gender Census was conducted in 2013, and the second Gender Census was conducted in 2015.

Based on the results of these surveys, the most common term used by people with a gender outside the binary appears to have changed from genderqueer to nonbinary around 2014.

I examined this result in the most recent article in the series. 


The 2013 Gender Census had fewer respondents than any subsequent survey, and Cassian, the administrator of the Gender Census, has described the 2013 survey as, “more of a pilot survey that informed a better survey in 2015.”

This article, and the ones that follow, will focus on the results from 2015 to the present, although data from 2013 will be referenced when relevant.

We will explore how the terms included in the 2024 Gender Census have performed over the past 10 years.

In this article, we’ll begin by examining the most popular terms from the 2024 Gender Census.


This graph shows how the seven most popular identity terms from 2024 have performed in each Gender Census since 2015.

We’ll explore the top five terms today.


Make sure to pay attention to the Y-axes of the line graphs in this series. Very few of them will begin at 0.

I created the graphs in this article using flourish, a website that allows users to create compelling visual aids.


Nonbinary


Nonbinary refers to someone whose gender identity isn’t exclusively male or female.

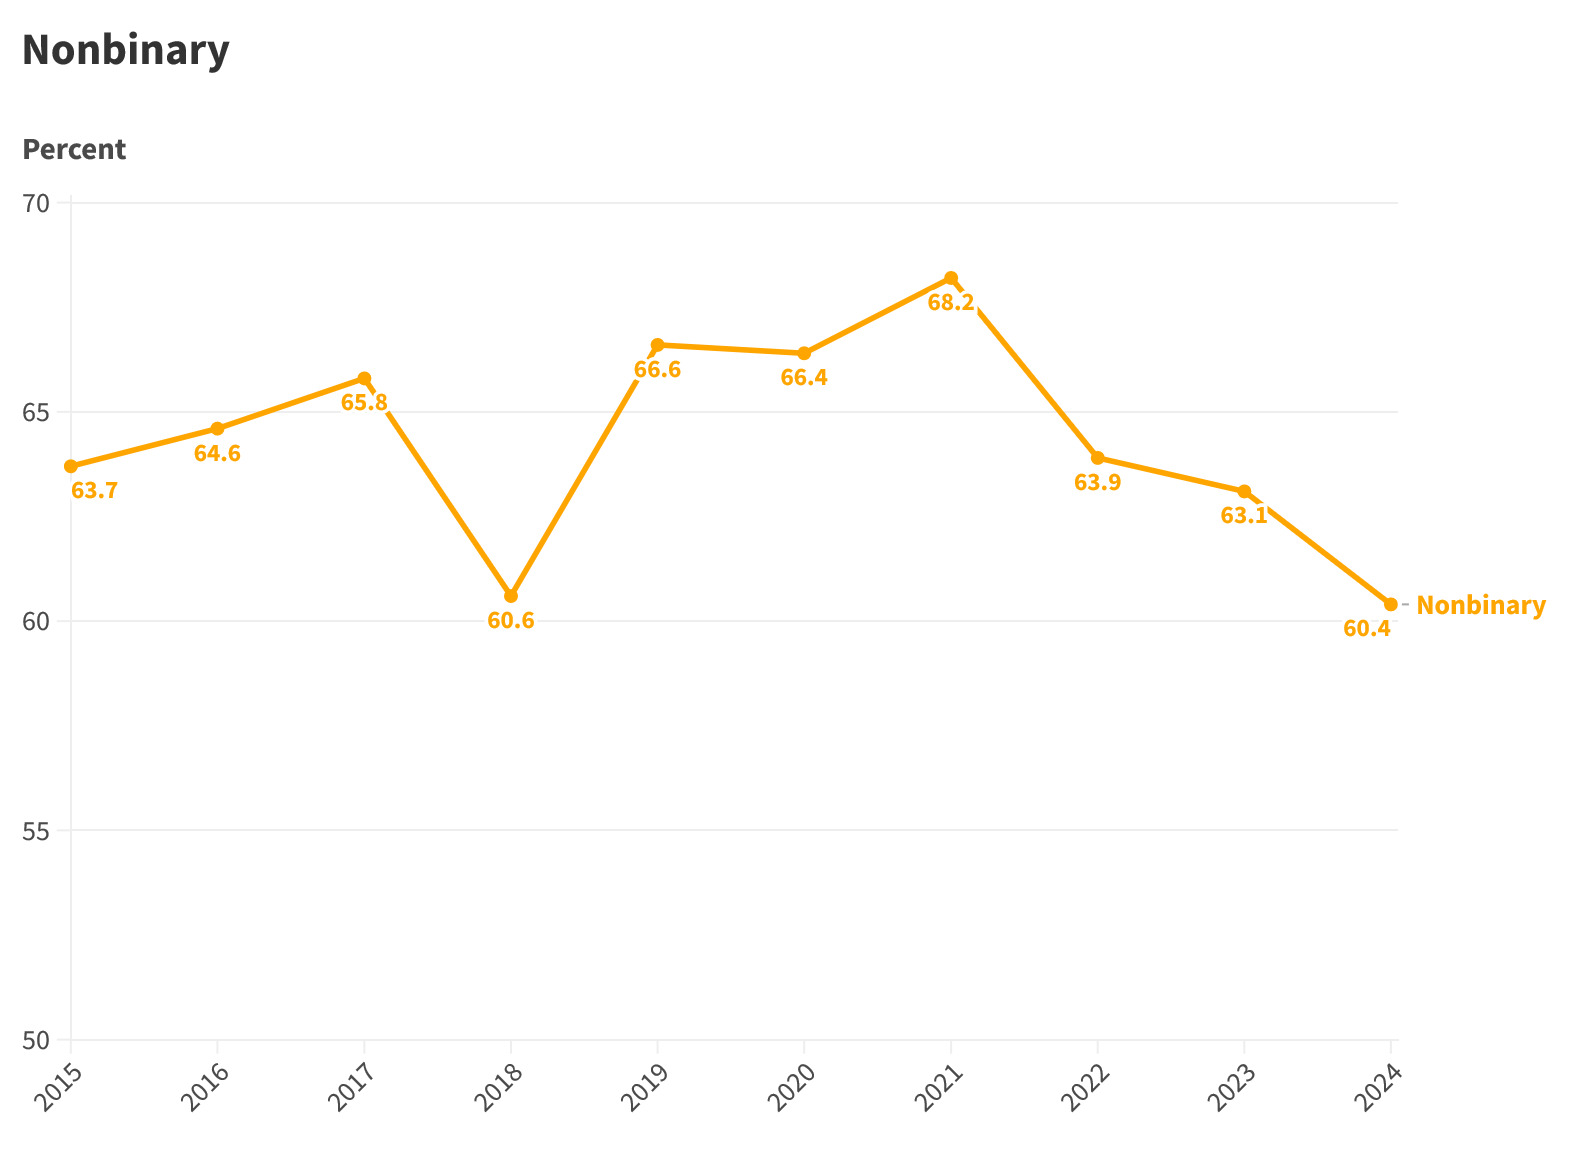
Every year since 2015, nonbinary has been the identity term chosen by the most Gender Census respondents.


You may find yourself in a situation where you want to refer to the group of people who don’t identify as male or female.

Nonbinary is the best word you can use in this situation, based on the results of the Gender Census.

For example, you might want to ask someone their gender, either in person or as a question on an official document.

When addressing a group of people, you might want to use gendered language, without leaving anyone out, such as, “men, women, and nonbinary people,” or  “ladies, gentlemen, and nonbinary guests.”


Since 2015, nonbinary’s performance in the Gender Census has been strong and consistent, although it has slowly and narrowly declined in recent years.

Nonbinary’s maximum was 68.2% in 2021. 

Nonbinary’s minimum was 60.4% in 2024.

Therefore, nonbinary’s range is 7.8%.

That’s a small range compared to the other top terms in the Gender Census. 


The ranges listed in this series refer to the past 10 years, from 2015-24, which means they don't include the results of the pilot 2013 survey. 


Nonbinary is the only term that has ever surpassed 60% in the Gender Census.


In 2013, nonbinary received 38.6%, which is considerably less than it has received in subsequent years.

I discussed nonbinary’s performance in the 2013 Gender Census in an earlier article.


Queer


Queer is an umbrella term that refers to anyone who is LGBT, including nonbinary people.

I discussed the meaning and history of the term “queer” in The Big Picture and Thoughts on the Acronym, which are both part of Season 1 of LGBT by the Numbers.


Queer can be used to describe someone’s sexuality or gender. 

When it first appeared as a checkbox in 2019, queer was the second most commonly chosen term.

In subsequent surveys, Cassian added a parenthetical to queer to clarify they are asking respondents whether they describe their gender as queer.

In ‘20 and ’21 the checkbox was, “queer (partially or completely in relation to gender)”.

In ’22, ’23, and ‘24  the checkbox was, “queer (in relation to gender)”.


Other than nonbinary, Queer is the only other term that has been chosen by a majority of Gender Census respondents, since 2015.

Queer received more than 50% in ’22, ’23, and ’24. 

Queer has been the second most popular term in the Gender Census, since it first appeared as a checkbox option in 2019.


Queer’s minimum was 42.9% in 2020.

Queer’s maximum was 54.8% in 2023.

Therefore, queer’s range is 11.9%.


Trans & Transgender


Transgender describes someone who identifies with a gender different than the one they were assigned at birth.

Trans is a shortened form of transgender.


In the 2024 Gender Census, trans was the third most popular term, and transgender was the fifth most popular term.


Trans and transgender rise and fall in synchronicity in the Gender Census.


Trans is consistently chosen by a larger number of respondents.

On average, trans outperforms transgender by 5.3%.


Trans


Trans has been the third most popular term in the Gender Census since 2022.


As you can see, the popularity of trans has increased in recent years.


In 2017, trans reached its minimum of 30.0%.

In 2023, trans reached its maximum of 46.7%.

Therefore, trans has a range of 16.7%.

Trans has the second largest range of any identity term in the Gender Census.


Transgender


Transgender has been the fifth most popular term in the Gender Census since 2022.

Transgender has also seen an increase in popularity in recent years.


First, let’s look at transgender’s performance in the Gender Census since 2015.

Transgender’s minimum was 23.9% in 2017.

Transgender’s maximum was 40.3% in 2023.

Therefore, transgender has a range of 16.4%.

Transgender has the third largest range of any identity term in the Gender Census. 


In 2013, transgender was chosen by 23.7% of respondents, which is less than it has received in any subsequent survey. 


We have discussed the first, second, third, and fifth most popular terms from the 2024 Gender Census.

But, we still need to discuss the fourth most popular checkbox identity, “A person / human / [my name] / ‘I’m just me.’"

However, to understand this option, we must first examine the history of one of the least popular options on the Gender Census, “none.”


None


The Gender Census asks respondents, “Which of the following best describe(s) in English how you think of yourself?”

Respondents can choose as many checkbox terms as they wish, and they can also submit write-in responses.

One of the checkbox options is, “none.”


"None" was the third least commonly selected checkbox in 2024. 

"None" was only chosen by 4.6% of respondents.


A small change in the wording of the option for “none” in 2022 had a large effect on the number of people who chose it.


“None” was first introduced as an option in 2016, and its wording has undergone a few subtle changes over time.

In 2016, it was, “none / do not describe.”

In 2017, it was, “none / I do not describe.”

From 2018-21, it was, “none / I do not describe myself.”


In 2022, Cassian, who administers the Gender Census, changed the option for “none” to “ none / I do not describe myself / ‘I’m just me.’”

Cassian did so because respondents submitted write-ins that were similar to what Cassian meant to convey through the option for “none.”

Examples of these write-ins included terms like, "person, human, [my name], and 'I’m just me.' "

The addition of “I’m just me,” spiked the popularity of "none" from 4.4% in 2021 to 16.9% in 2022.


Cassian changed the wording back to, “none / I do not describe myself,” for 2023 and 2024.

But the popularity of the “I’m just me” addendum in 2022 convinced Cassian to add a different option to the Gender Census, beginning in 2023.


A person / human / [my name] / “I’m just me”


Based on feedback, Cassian added the option listed above as a checkbox in 2023.

In their report on that year’s results, Cassian described the checkbox as, “an affirmative description," based on write-ins, as opposed to, “a lack of description,” for the “none” option.


“A person …” received 42.5% in 2023.

“A person …” received 39.1% in 2024.


In both years, “A person …” was the fourth most popular checkbox option.

That’s a pretty strong performance, especially for a somewhat inscrutable choice.


"A person..." appears in yellow on the line graph below.  


At first glance, it might not seem fair for compact terms, often consisting of only a single word, to compete with such a long-winded response.

The amalgamate consists of four separate responses, divided by slashes.

However, I do believe the composite does represent a single idea.

These are all responses where someone seeks to avoid characterizing their gender and instead describes themselves based on a non-gendered descriptor.


I personally find it strange to dodge the question of how you describe your gender, in a survey about that very topic, but it’s an approach that is widely shared by nonbinary people, as the results from the last two years can attest.

I believe it makes sense to continue to include the verbose response among the checkbox options in future surveys, despite its inherent clunkiness.


If you would like to learn more, I discussed the terms nonbinary, queer, trans, and transgender in an article I wrote about the results of the 2023 Gender Census.


In the next article, we’ll continue our tour of Gender Census results by examining gender non-conforming, genderqueer, and enby.


Sunday, January 19, 2025

Republicans win Senate control


This article is the second in a series about the results of the 2024 general election. The first article discussed the results of elections for the House of Representatives.


After the 2024 elections, there are 53 Republicans and 47 Democrats in the US Senate.

The Democratic total includes Bernie Sanders and Angus King, two Independents who caucus with the Democrats.


Here is a visualization showing the number of seats held by Republicans and Democrats in the Senate.

I created the visualization using flourish, a website that allows users to create compelling visual aids.


Prior to the 2024 elections, there were 51 Democrats and 49 Republicans in the Senate.

Republicans flipped four Senate seats in 2024: West Virginia, Montana, Ohio, and Pennsylvania.

Democrats didn’t flip any Senate seats in 2024.


Closest Races


The following table shows the closest 2024 races. It also includes West Virginia, which wasn’t remotely close, because it was one of the four states Republicans flipped.


The table lists the candidates, the 2024 margin by both percent and votes cast, whether the state flipped, and the 2018 margin in the state.

The margin swing shows which party performed better in 2024 compared to 2018, and by how much.


Incumbents are represented by “(i)”.

This table is organized by the 2024 margin, with the closest contests listed first.

The table is color coded, with different shades used to indicate which margins are smaller or larger than 10%.


There were several close Senate races this year.

Pennsylvania, Michigan, and Wisconsin were all decided by less than 1%.

Nevada, Arizona, and Ohio were decided by less than 5%.


Almost all of the races in this table swung toward Republicans compared to 2018, the last time these seats were up for election.


Only two races didn’t swing toward Republicans.

In Arizona, the margin remained exactly the same, creating a margin swing of 0. 

In both 2018 and 2024, the Democratic candidate won Arizona by 2.4%. 


In Nebraska, Independent Dan Osborn ran against Republican incumbent Deb Fischer in a one-on-one race, after Democrats chose not to nominate a candidate.

Osborn reduced Fischer’s margin of victory in 2024 by 12.4% compared to what it had been in 2018.

Fischer still won by 6.7%, but Nebraska was the only Senate seat, at least among the closest elections, where the margin of victory shifted away from Republicans, compared to 2018.


If Kamala Harris had managed to win the presidential election, Nebraska would have been the tipping point state for Senate control.

Because Donald Trump won the presidential election, Montana was the tipping point election for Senate control.


The largest swing toward Republicans, among the races listed here, was in West Virginia, where Republicans performed 44.3% better than they did in 2018.

Incumbent Joe Manchin, who was elected in 2018 as a Democrat, chose not to run for reelection.

Republican Jim Justice ran for the West Virginia Senate seat in 2024, while he was the state's sitting governor. He won by a margin of 41%, in a landslide victory.


Other large swings toward Republicans took place in Maryland, New Mexico, Pennsylvania, and Florida.


This map shows the results of the 2024 US Senate elections.

I created the map using mapchart.net.


Republicans won by less than 10% in Pennsylvania, Ohio, Nebraska, Montana, and Texas.

Democrats won by less than 10% in Michigan, Wisconsin, Nevada, Arizona, Virginia, and New Jersey.

States Democrats won by more than 10% are shown in dark blue.

States Republicans won by more than 10% are shown in dark red.

The two Independent candidates, who caucus with the Democrats, were up for reelection this year. They both won reelection by more than 10%. Their states are shown in dark green.


Like the table above, the table below shows the 2018 and 2024 margins in key Senate races, but this table is organized by the 2018 margin.

The table uses two shades of blue and two shades of red to differentiate between values greater and less than 10%.

The table contains all regularly scheduled races from 2018 that were decided by less than 10%. It also includes other races that were considered competitive prior to the 2024 election.


Nebraska remains the only Senate election where anyone gained ground against Republicans, compared to 2018.

I find it striking Republicans were able to flip Pennsylvania, even though Bob Casey Jr. won the state in 2018 by 13%.


Historical context


This table lists the Senate seats held by Democrats and Republicans after each election since 2000. 

I created the table using information from Wikipedia.  


Independents who align with Democrats are counted as Democrats.

Tracking partisan control of the Senate isn’t possible without doing so.


Ties in the Senate are broken by the Vice President, which gives majority control of a 50-50 Senate to the party that won the most recent presidential race.

Dick Cheney broke a tie to give Republicans Senate control after the 2000 election.

Kamala Harris broke a tie to give Democrats Senate control after the 2020 election.


Since 2000, Republicans have controlled the Senate after seven elections, and Democrats have controlled the Senate after six elections.

That is as close to an even split as you can have for an odd number.


Here are what these values look like on a line graph.

The graph was created using flourish.


The largest majority on the graph was after the 2008 election, when Democrats held 59 seats.

There were two times where a party held 55 seats.

Republicans held 55 seats after the 2004 election, and Democrats held 55 seats after the 2012 election.


In the next article, we’ll grade my Senate predictions, and examine the accuracy of polling for the Senate contests. 


Thursday, January 9, 2025

Republicans retain House control


In 2024, Republicans retained control of the US House of Representatives.

Republicans won 220 seats, and Democrats won 215 seats.


The House of Representatives represented a small silver lining for Democrats, because they managed to gain two more seats in the chamber than they won in 2022.

The small size of Republican House majority will make it harder for Republicans to pass legislation than if they had more votes to spare.


Closest Races


It’s time to break out the tables.


Our first table examines the 11 House races that were decided by less than 2% in 2024.

The table describes the margins of victory by both percent of total votes cast and by the number of votes.

The symbol “(i)” represents the incumbent candidate in an election.  

You can click on any table or graph in this series to view a larger version. 


I originally obtained many of the election results that appear in this series from the New York Times.

I have done my best to double and triple check all of the statistics in this series, but if you notice I made a mistake, let me know.


Our next table table provides additional information about the 11 races shown above.


This table includes the 2022 margin in these districts, whether the district flipped, and whether the 2024 election was a rematch between the same candidates who ran against each other in 2022.

This table also lists whether the result in the district shifted in favor of Democrats or Republicans in 2024, and by how much.

Six of these districts shifted in favor of Republicans in 2024, and five shifted in favor of Democrats.


The tipping point district for House control was Pennsylvania 7, where Republican challenger Ryan Mackenzie defeated Democratic Incumbent Susan Wild by 1.0%.

If Democrats had managed to win Iowa 1, Colorado 8, and Pennsylvania 7, they would have won 218 seats and secured House control.


This table examines the 2024 results in the House districts that were the closest races in 2022.

A total of 11 races were decided in 2022 by less than 1%.

Six of these districts shifted in favor of Republicans in 2024, and five shifted in favor of Democrats.


Two districts had races that were among the 11 closest House elections in both 2022 and 2024.

In California 13, Democrat Adam Gray won a rematch in 2024 against Republican incumbent John Duarte.

In both 2024 and 2022, the winner of the election was decided by less than 1%.


In Colorado 8, Republican challenger Gabe Evans defeated Democratic incumbent Yadira Caraveo in 2024.

In both 2024 and 2022, the district was decided by less than 1%.


Historical Context


Now let’s explore how this House majority compares to others in recent American history.


This table lists the seats controlled by Democrats, Republicans, and Independents after each election since 1990.

I compiled this table using data from Wikipedia, which I believe is a reasonably reliable source for these kinds of statistics.

Republicans have the narrowest House majority of either party since 1990.


Since 1990, Republicans won a House majority after 12 elections, Democrats won a House majority after six elections.

Republicans won House control twice as often as Democrats during this period.


Let’s view this information on a line graph.

This graph shows the outcome of House elections beginning in 2006.


Immediately, you can see how narrow the majorities have been in the US House in the last three elections, compared to previous years.


Now, let’s zoom out to view all of the elections since 1990.


Recent House majorities look even smaller on this graph.

I created these line graphs using Flourish, a website that allows users to create compelling visual aids. 


CNN has published a good article about the political dynamics in the current narrow House majority, and the history of narrow House majorities from the early Twentieth Century. 


In the next article, we’ll examine the results of the 2024 US Senate elections.