Men are equally likely to identify as gay or bisexual, according to a Gallup poll.
This is just one of many fascinating findings from Gallup’s most recent poll on LGBT identity in the US.
In 2023, Gallup asked more than 12,000 US adults if they identify as heterosexual, lesbian, gay, bisexual, transgender, or something else.
Today, we will continue our exploration of Gallup’s results by breaking down those results by gender.
I will also compare Gallup's most recent results to its data for previous years to show how these statistics have changed over time.
The statistics about LGBT identity in this article are for US adults, and LGBT statistics could be different for residents of other countries.
Gallup provided data about LGBT identity for women, men, and nonbinary people.
Non-binary describes people who identify with a gender that isn’t exclusively male or female.
I discussed nonbinary identity in “Gender Identity and Biological Sex” and “How nonbinary people describe themselves.”
We will discuss Gallup’s data about nonbinary people at the end of this article.
Women are more likely to identify as LGBT than men.
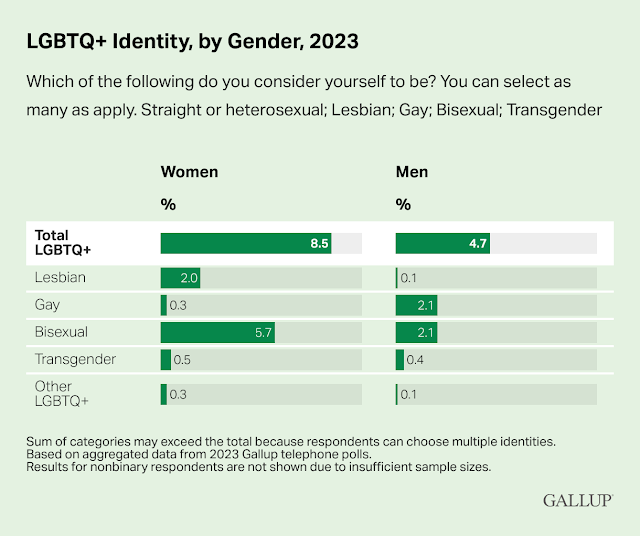
Based on Gallup’s data, 8.5% of women identify as LGBT, and 4.7% of men identify as LGBT.
Therefore, among US adults, women are about 1.8 times more likely to identify as LGBT than men.
These numbers have changed slightly since 2020, when 6.4% of women identified as LGBT, and 4.9% of men identified as LGBT.
In the following table, Gallup provides the percent of women and men who identify with specific LGBT identities.
As you can see, a small number of women told Gallup they identify as gay, and an even smaller number of men said they identify as lesbian.
0.3% of women identified as gay in Gallup's survey.
Gay has long been used to refer both to gay men and lesbian women, so I don’t find it surprising that a small number of women said they identify as gay.
The lesbian men are a bit more perplexing.
My best guess is that these are transgender men who identified as lesbians before transitioning to male, and continued to identify as lesbians after transition.
Regardless, only 0.1% of men identify as lesbian, so it’s quite small compared to the other numbers we have to explore.
Gay and Bisexual Men
Men are now equally likely to identify as bisexual or gay.
Among US adults, 2.1% of men identify as bisexual, and 2.1% of men identify as gay.
Previously, men were more likely to identify as gay than bisexual.
Gallup didn’t break down its 2022 results by gender.
But Gallup did break down its 2021 LGBT results by gender.
In 2021, 2.5% of men identified as gay, compared to 2.0% who identified as bisexual.
In 2020, 2.5% of men identified as gay, and 1.8% identified as bisexual, according to Gallup.
Later in this article, we’ll examine the fascinating generational differences among US men regarding LGBT identity.
Bisexual and Lesbian Women
Women are about three times as likely to identify as bisexual than lesbian.
Among US adults, 5.7% of women identify as bisexual, and 2.0% of women identify as lesbian.
In 2021, 6.0% of women identified as bisexual, and 1.9% identified as lesbian.
In 2020, 4.3% of women identified as bisexual, and 1.3% identified as lesbian.
Women are about as likely to identify as lesbian, as men are to identify as gay.
2.0% of women identify as lesbian, and 2.1% of men identify as gay.
Women are more likely than men to identify as bisexual.
5.7% of women identify as bisexual, and 2.1% of men identify as bisexual.
This means women are about 2.7 times more likely to identify as bisexual than men.
LGBT Identity by Gender and Generation
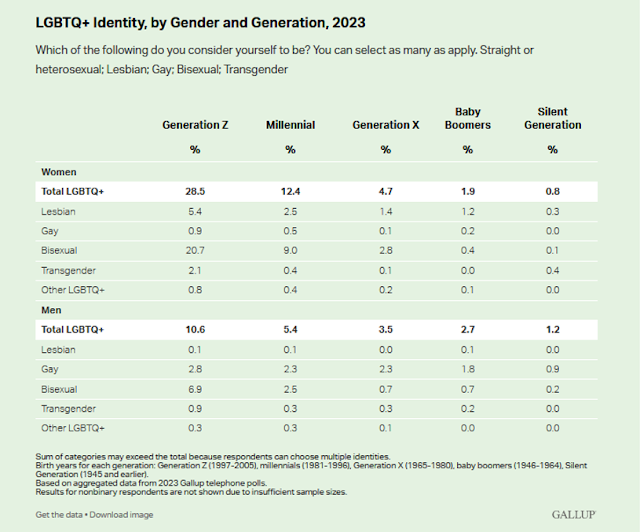
Gallup broke down its results in a large table showing the percent of women and men in each generation who identify with specific LGBT identities.
I used Flourish to create several bar graphs to more easily visualize the data in this table.
First, let’s compare the percent of women and men in each generation who identify as LGBT.
Among Gen Z, Millennials, and Gen X, women are more likely than men to identify as LGBT.
Among Baby Boomers and the Silent Generation, men are more likely than women to identify as LGBT.
A total of 28.5% of Gen Z women identify as LGBT.
12.4% of Millennial women identify as LGBT.
10.6% of Gen Z men identify as LGBT.
These are the largest numbers in the data set shown on the bar graph above.
LGBT Men
Now, let’s take a closer look at LGBT men.
Gen Z men are far more likely to identify as bisexual than gay.
6.9% of Gen Z men identify as bisexual, and 2.8% of Gen Z men identify as gay.
That means Gen Z men are about 2.5 times more likely to identify as bisexual than gay.
Millennial men are slightly more likely to identify as bisexual than gay.
2.5% of Millennial men identify as bisexual, and 2.3% of Millennial men identify as gay.
Among Gen X, Baby Boomers, and the Silent Generation, men are considerably more likely to identify as gay than bisexual.
So men are now equally likely to identify as bisexual or gay, because so many Gen Z men identify as bisexual, despite older men being much more likely to identify as gay.
LGBT Women
Now, let’s take a closer look at LGBT women.
Notice the scale on this graph is different than the one for LGBT men, because the values on this graph are larger.
Gen Z, Millennial, and Gen X women are more likely to identify as bisexual than lesbian.
Baby Boomer and Silent Generation women are more likely to identify as lesbian than bisexual.
A total of 20.7% of Gen Z women identify as bisexual. That’s more than 1 in 5.
5.4% of Gen Z women identify as lesbian.
Gen Z women are about 3.8 times as likely to identify as bisexual than lesbian.
9.0% of Millennial women identify as bisexual, and 2.5% of Millennial women identify as lesbian.
Millennial women are 3.6 times as likely to identify as bisexual than lesbian.
Bisexual Identity by Gender and Generation
Bisexual is consistently the largest specific LGBT identity in Gallup’s annual poll.
I created a bar graph to compare bisexual identity by gender and generation.
Women are more likely to identify as bisexual than men among Gen Z, Millennials, and Gen X.
Men are more likely to identify as bisexual than women among Baby Boomers and the Silent Generation, although those numbers are quite small.
20.7% of Gen Z women are bisexual, and 6.9% of Gen Z men are bisexual.
Gen Z women are 3 times more likely to be bisexual than Gen Z men.
9.0% of Millennial women are bisexual, and 2.5% of Millennial men are bisexual.
Millennial women are 3.6 times more likely to be bisexual than Millennial men.
Nonbinary Responses
For the first time, Gallup has provided data about LGBT identity among nonbinary respondents.
Non-binary refers to people who identify with a gender that isn’t exclusively male or female.
Some people identify as nonbinary without specifying a more specific gender identity.
Other nonbinary people identify with a more specific gender identity, such as genderfluid or agender.
Gallup’s results for nonbinary and transgender Americans is consistent with the findings of similar surveys.
According to Gallup, about 1% of US adults identify as nonbinary.
This matches findings from the Pew Research Center, which also found that 1% of US adults identify as nonbinary.
I first discussed Pew's results in "Gender Identity in the United States."
Gallup was less comfortable providing a detailed breakdown for LGBT identity among nonbinary adults than they were for men and women, because they didn’t have as many responses from nonbinary people to analyze.
So Gallup combined its data from 2022 and 2023 to approximate results for nonbinary respondents.
About one-third of nonbinary respondents identified as bisexual, and about one-third identified as transgender.
This means nonbinary people are about 6 times more likely to identify as bisexual than women, and about 16 times more likely to identify as bisexual than men.
Personally, I consider nonbinary people to be transgender, by definition, because they identify with a gender identity different than the one they were assigned at birth.
But I still find it interesting whether nonbinary people personally describe themselves as transgender in surveys.
Gallup found one-third of nonbinary US adults identify as transgender, based on data from 2022 and 2023.
But they aren’t the only survey that asks nonbinary people whether they identify as transgender.
The Gender Census is an annual online survey of nonbinary people from around the world.
In 2022, 33.9% of Gender Census respondents identified as transgender.
In 2023, 40.3% of Gender Census respondents identified as transgender.
The average of these two values is 37.1%.
Gallup’s poll is a survey of US adults, and the Gender Census is a global poll of self-selected nonbinary people.
Nonetheless, their results regarding the percent of nonbinary people who identify as transgender are fairly close, considering the differences in their survey population.
We can use Gallup’s data about nonbinary respondents to better understand their results regarding transgender identity.
Gallup determined 0.9% of US adults identified as transgender in 2023.
About 1% of US adults identify as nonbinary, and about a third of nonbinary people identify as transgender.
That means about 0.33% of US adults are nonbinary people who identify as transgender.
Therefore, about 0.6% of US adults are binary transgender, and about 0.3% of US adults identify as nonbinary and transgender, based on Gallup’s data.
The Pew Research Center determined 0.6% of US adults identify as binary transgender in their 2022 survey.
This finding is consistent with Gallup’s results for transgender identity in the US.
Gallup’s data regarding LGBT identity in the US is high quality and endlessly fascinating.
But I believe it produces a slight undercount of the LGBT population in the US.
In the next article, I will explain why I believe Gallup’s LGBT total is slightly too small, and what I believe the true total to be.


No comments:
Post a Comment