The percent of Americans who identify as LGBT has increased every year Gallup has surveyed US adults about their sexualities and gender identities.
In its most recent annual report, the percent of Americans who identify as LGBT increased by the most it ever has, since Gallup began tracking LGBT identity in 2012.
A total of 9.3% of US adults identified as LGBT in 2024, according to Gallup.
The polling firm’s results are based on phone surveys with more than 14,000 US adults in 2024.
Gallup asked respondents whether they identify as straight or heterosexual, lesbian, gay, bisexual, transgender, or something else.
Change over time
The percent of US adults who identify as LGBT has nearly tripled since Gallup began tracking LGBT identity in 2012.

I created the graphs in this article using flourish, a website that allows users to create compelling visual aids.
You can view larger versions of the graphs and tables in this article by clicking on them.
Here are the values used to create the line graph above.

In 2012, only 3.5% of US adults identified as LGBT.
By 2024, the proportion of US adults who identify as LGBT rose to 9.3%.
The wording of Gallup’s LGBT question has changed only slightly over the past 12 years.
From 2012-17, respondents were asked, “Do you, personally, identify as lesbian, gay, bisexual, or transgender?”
Respondents could answer with a “yes” or “no”.
Gallup did not collect data on LGBT identity in the US in 2018 or 2019.
Beginning in 2020, Gallup has asked respondents whether they identify as straight or heterosexual, lesbian, gay, bisexual, transgender, or something else.
Respondents can then tell the interviewer which identities they use.
Gallup has estimated the percent of LGBT Americans 11 times.
The largest increase in LGBT identification in the US took place last year.
In 2024, the percent of US adults who identified as LGBT increased by 1.7%, compared to 2023.
The next largest increase was in 2021, when 1.5% more Americans identified as LGBT than did so in 2020.
The third largest increase took place from 2017-2020, when the percent of LGBT US adults grew by 1.1%.
These are
the only times when the percent of LGBT US adults increased from the prior estimate
by more than 0.5%.
Specific Identities
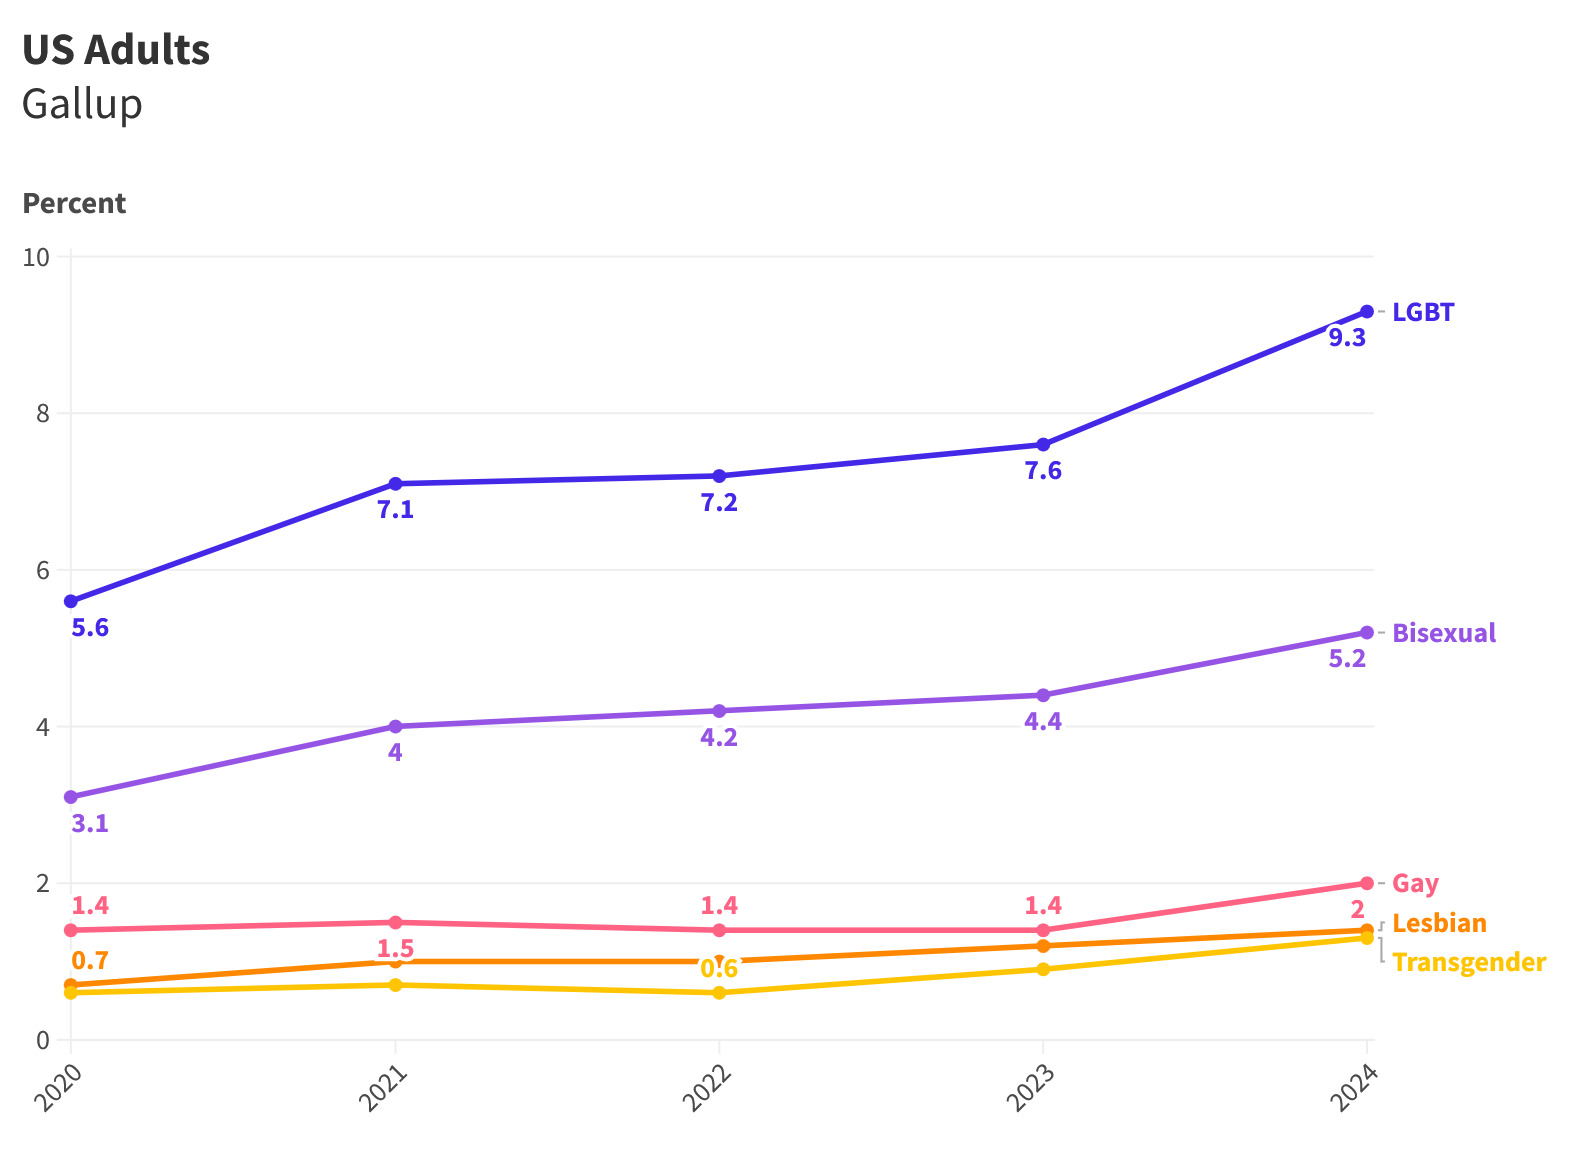
Gallup calculated the percent of US adults who identified with specific LGBT identities in 2024.
5.2% are bisexual, 2.0% are gay, 1.4% are lesbian, and 1.3% are transgender.
The percent of Americans who identify with each of these identities increased from 2023 to ’24.
Bisexual increased by 0.8%, gay increased by 0.6%, transgender increased by 0.4%, and lesbian increased by 0.2%.
Gallup has estimated the percent of US adults who identify with each of these specific identities for the last five years, beginning in 2020.
The order of the identities across US adults has remained consistent in each annual survey.
Bisexual is the most common LGBT identity, followed by gay, lesbian, and transgender, in that order.
This graph shows the percent of US adults who identified with each identity every year, since 2020.
It also shows the total number of US adults who identified as LGBT, since 2020.
I will show additional versions of this graph that allow the smaller figures to be more easily seen.
This graph displays the lines for specific LGBT identities.
You can see just how much the bisexual line towers over the others.

Finally, let’s zoom in on the identities at the bottom.

As the previous three graphs show, the lines for LGBT, bisexual, gay, lesbian, and transgender have each increased from where they began in 2020.
Here is the table of values used to create the graphs above.

A Closer Look
Looking closer at the data reveals LGBT Americans are becoming more comfortable disclosing their identities to Gallup over the phone.
In its annual reports, Gallup includes three broad categories of respondents: those who identify as LGBT, those who identify as straight or heterosexual, and those who decline to answer the question.
Examining what is happening to the non-LGBT categories can help us understand the dynamics behind the increase in the number of LGBT Americans.
Of the respondents who answer the question, Gallup’s figure for “Straight or Heterosexual” refers to anyone who doesn’t identify as LGBT.
This isn’t, strictly speaking, correct.
Transgender isn’t a sexuality, it’s a gender identity.
Transgender people can, and sometimes do, identify as straight.
But to understand Gallup’s data, we need to recognize the polling agency uses “Straight or Heterosexual” to refer to respondents who aren’t LGBT.
Sometimes, Gallup describes the percent of US adults who are “straight or heterosexual,” and the percent who decline to answer, to the nearest tenth of a percent.
Sometimes, Gallup rounds these figures to the nearest percent.
In its most recent report, Gallup said 85.7% of US adults identify as straight or heterosexual, and five percent decline to answer the question.
Since we know these figures, and those who identify as LGBT, should add together to make 100%, we can determine the percent who declined to answer was 5.0%.
In Gallup’s 2023 report, the polling firm reported 85.6% of US adults identified as straight or heterosexual, and 6.8% declined to answer.
From 2023 to ’24, the percent of US adults who identified as straight or heterosexual increased by 0.1%, which essentially means it remained the same.
More importantly, the percent of US adults who identified as LGBT increased by 1.7%, while the percent who declined to answer fell by 1.8%.
Therefore, the rise in LGBT identification in 2024 occurred because LGBT people became more comfortable disclosing their identities to Gallup.
We can also examine this trend over the past five years.
The following table rounds values to the nearest percent, both because Gallup doesn’t always provide all of the relevant figures to an additional degree of precision, and because the trend is actually easier to see without the extra decimal place.

We do have the additional degree of precision for 2020 and 2024, so I will use the extra decimal place in my analysis below.
Since 2020, the percent of US adults who are straight or heterosexual has decreased by 1.0%, from 86.7% to 85.7%.
The percent of US adults who decline to answer has decreased by 2.6%, from 7.6% to 5.0%.
Meanwhile, the percent of US adults who are LGBT has increased by 3.7%, from 5.6% to 9.3%.
This provides additional evidence that the primary driver of the growth in the number of LGBT Americans is the increasing willingness of LGBT people to disclose their identities to Gallup over the phone.
If we assume, for the sake of argument, the 5.0% who declined to answer in 2024 are also LGBT, that would imply the percent of US adults who are LGBT could actually be as high as 14.3%.
If this is the case, and LGBT people continue to become more comfortable sharing their identities with Gallup, the percent of US adults who identify as LGBT could continue to grow rapidly in the coming years.
Over the past few years, I have devoted many articles to covering LGBT statistics, including the results of Gallup’s earlier surveys.
“Sexual
Orientation in the United States” covered the results of Gallup’s 2022 survey.
I covered the results of Gallup’s 2023 survey in Season 2 of LGBT by the Numbers, which includes seven full-length articles.
If you’ve read this far, and you haven’t already read my earlier work, I imagine you would enjoy it as well.
Another interesting finding from Gallup’s results is that younger Americans are more likely to be LGBT than older Americans.
In the next article, we’ll examine the percent of each generation that identifies as LGBT, and see how these figures have changed over time.
No comments:
Post a Comment