This article is the third in a series on Gallup’s latest report on LGBT identity in the United States.
The first article discussed how the percent of Americans who identify as LGBT has changed over time, and how the percent of Americans who identify with specific LGBT identities has changed over time.
The second article examined the percent of each generation that identifies as LGBT, and how these figures have changed over time.
Gallup has determined 9.3% of US adults identify as LGBT.
The polling agency based its results on phone surveys with more than 14,000 US adults in 2024.
Gallup also calculated the percent of US adults who identify with specific LGBT identities.
5.2% are bisexual, 2.0% are gay, 1.4% are lesbian, and 1.3% are transgender.
Today, we are going to calculate the number of US adults each of these figures represent.
After we calculate the number of US adults who identify as LGBT, bisexual, gay, lesbian, and transgender, we will then compare these statistics to the populations of US states and territories.
At first glance, some of these statistics appear rather small, but each represents more people than the entire populations of US states.
For my comparisons, I will use estimates of state populations from the US Census. These figures are conveniently organized from largest to smallest on Wikipedia.
This will be the third time I have compared the number of LGBT Americans to state populations.
I made these comparisons in both Season 1 and Season 2 of LGBT by the Numbers, a series that examines LGBT statistics in the United States and around the world.
In Season 1, I used surveys conducted by Gallup, the Pew Research Center, and a research study for my comparisons.
How many Americans are LGBT? used Gallup’s LGBT data from 2022.
In Season 2, I used the results of Gallup’s 2023 LGBT survey for my comparisons.
Overview compared Gallup’s LGBT total to the populations of the largest US states.
Specific Identities compared Gallup’s results for individual LGBT identities to the populations of US states.
A Better LGBT Total added additional LGBT people I believe Gallup leaves out of its total. I then compared my larger total to US states.
Gallup’s LGBT Total
Gallup determined 9.3% of US adults identified as LGBT in 2024.
267 million adults lived in the United States in 2024, according to the US Census.
That means 25 million US adults are LGBT.
@2x.jpeg)
The numbers for LGBT identities in this article refer to adults, whereas the population statistics include all ages.
The number of LGBT US adults, based on Gallup’s total, is closest to the population of Florida, which is home to 23 million people.
From 2023 to ’24, the number of LGBT US adults, based on Gallup’s total, surpassed the population of the state of Florida.
Only two states, California and Texas, have larger populations than the total number of US adults who are LGBT.
Therefore, the number of LGBT US adults is larger than the populations of 48 states.
However, I believe Gallup slightly undercounts the number of LGBT Americans, for reasons I will explain later in this article.
After I calculate a revised prevalence rate, I will calculate what I believe is a better total.
But first, let’s examine the number of Americans who are bisexual, gay, lesbian, and transgender.
Bisexual
5.2% of US adults identified as bisexual in 2024, according to Gallup.
That means there are 14 million bisexual US adults.
@2x.jpeg)
The number of bisexual US adults is closest to the population of Pennsylvania, which is home to 13 million people.
From 2023-24, the number of bisexual US adults surpassed the populations of Ohio, Illinois, and Pennsylvania.
Only four US states, California, Texas, Florida, and New York, have larger populations than the number of bisexual US adults.
The number of bisexual US adults is larger than the populations of 46 US states.
Gay
2.0% of US adults identified as gay in 2024, according to Gallup.
That means there are 5.3 million gay US adults.
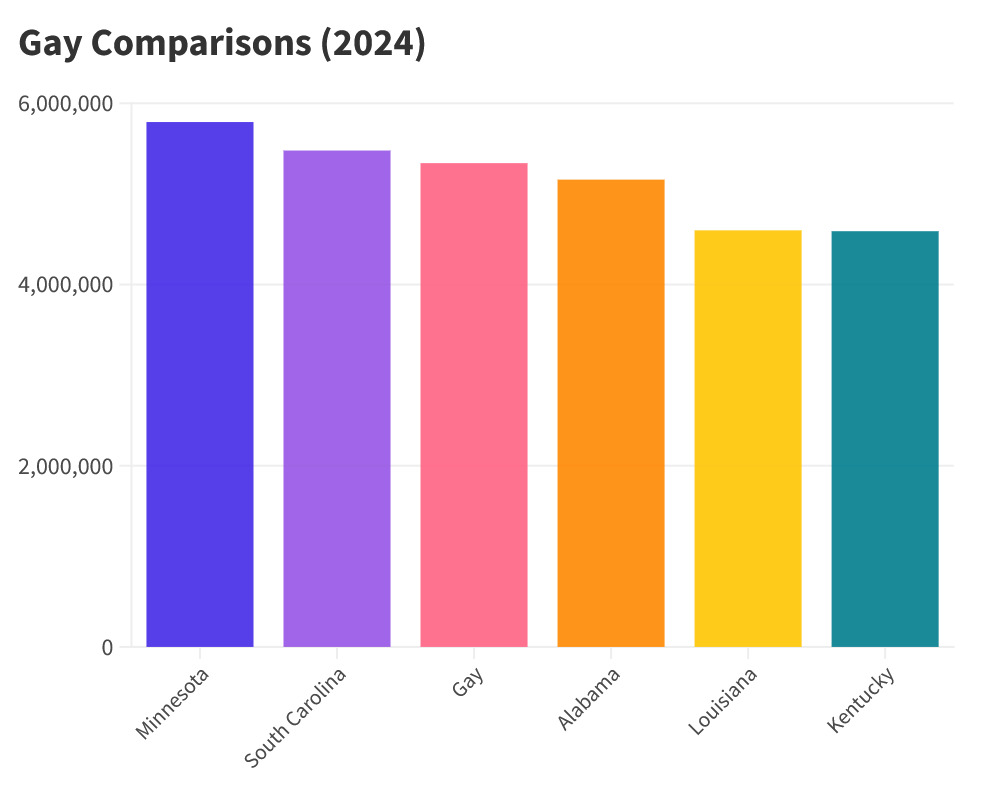
The number of gay US adults is closest to the population of South Carolina, which is home to 5.5 million people.
From 2023 to ’24, the number of gay US adults surpassed the populations of Oklahoma, Oregon, Kentucky, Louisiana, and Alabama.
23 states have larger populations than the number of gay US adults.
Therefore, the number of gay US adults is larger than the populations of 27 states.
Lesbian
1.4% of US adults identified as lesbian in 2024, according to Gallup.
That means there are 3.7 million lesbian US adults.
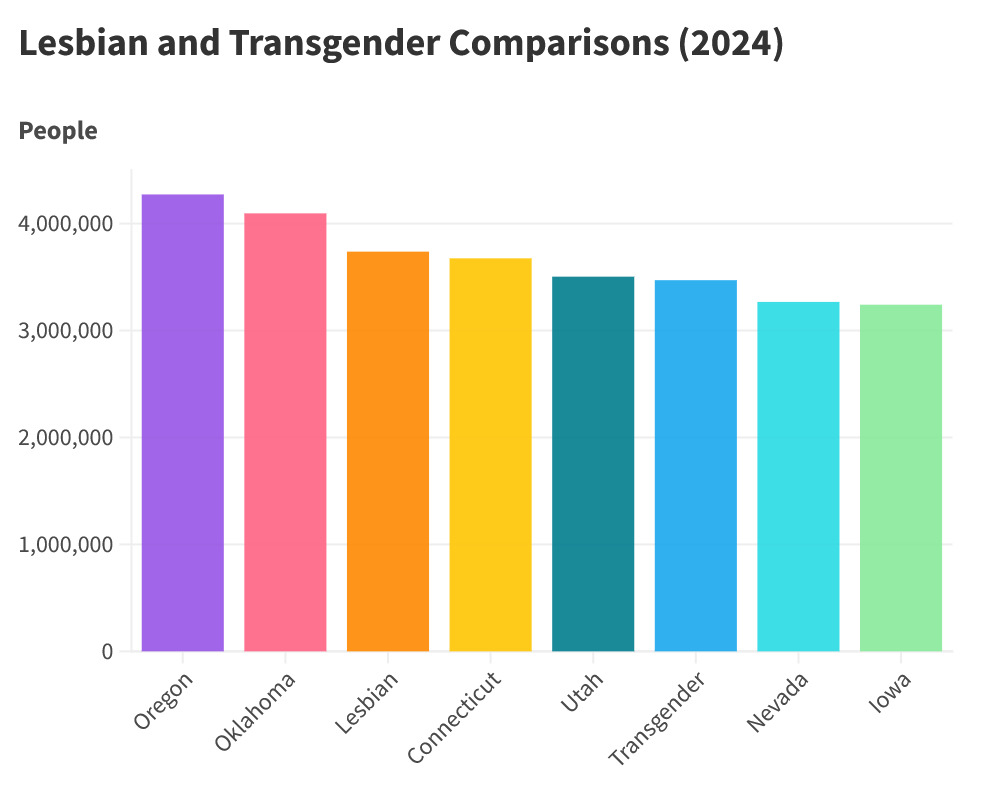
The number of lesbian US adults is closest to the population of Connecticut, which is home to 3.7 million people.
From 2023 to ’24, the number of lesbian US adults surpassed the populations of Puerto Rico, Iowa, Nevada, Utah, and Connecticut.
28 states have a larger population than the number of lesbian US adults.
Therefore, the number of lesbian US adults is larger than the populations of 22 states.
Transgender
1.3% of US adults identified as transgender in 2024, according to Gallup.
This means there are 3.5 million transgender US adults.
Before we continue, let’s take a closer look at Gallup’s process.
Gallup asked US adults whether they identified as transgender.
That means Gallup’s figure for transgender Americans includes those who are binary transgender AND the portion of nonbinary Americans who identify as transgender.
Nonbinary describes someone whose gender isn't exclusively male or female.
My earlier comparisons used the results from the Pew Research Center, which used a different process to calculate the prevalence of binary transgender and nonbinary identities.
The Pew Research Center conducted its survey on Gender Identity in the United States in 2022.
But Pew has not revisited the topic in subsequent years.
So in the absence of new data from Pew, I am going to use Gallup’s results for my comparisons.
Just keep in mind that Gallup and Pew use different methods for their transgender estimates.

The number of transgender US adults, based on Gallup’s results, is closest to the population of Utah, which is home to 3.5 million people.
30 states have a population that is larger than the number of transgender US adults.
Therefore, the number of transgender US adults is larger than the populations of 20 states.
The number of transgender US adults is also larger than the populations of Puerto Rico and the District of Columbia.
A Better LGBT Total
I believe Gallup slightly undercounts the number of Americans who are LGBT.
Gallup considers someone to be LGBT if they identify as lesbian, gay, bisexual, or transgender, or if they submit a volunteered response.
I consider someone to be LGBT if they have a minority sexual orientation or gender identity.
For reasons explained below, I believe Gallup undercounts the percent of US adults who are LGBT by 0.4%.
I believe Gallup’s LGBT total undercounts the number of nonbinary and asexual Americans.
Let’s talk about nonbinary Americans, first.
Nonbinary refers to someone with a gender that isn’t exclusively male or female.
Because nonbinary is a minority gender identity, I consider all nonbinary people to be LGBT.
In its most recent report, Gallup estimates between 1% and 2% of US adults are nonbinary.
About 80% of nonbinary US adults are LGBT, based on Gallup’s methodology.
Because I consider all nonbinary people to be LGBT, regardless of their other identities, I believe at least an additional 0.2% of US adults are LGBT, compared to Gallup’s total.
For the purposes of my calculation, I will be using Gallup’s lower estimate for the prevalence of nonbinary identity.
Now, let’s talk about asexuals.
Asexual refers to someone who doesn’t experience sexual attraction.
I consider asexual to be an LGBT identity, because it’s a minority sexual orientation.
I calculated about 0.3% of US adults identify as asexual, based on a 2020 research study.
0.1% of US adults provided asexual as a volunteered response to Gallup.
If asexual were explicitly included in Gallup’s question, I believe an additional 0.2% of US adults would be counted as LGBT, compared to Gallup’s total.
If we add the missing nonbinary and asexual Americans, then 9.7% of US adults are LGBT.
That would mean 26 million US adults are LGBT.
This is my best estimate for size of the adult LGBT population in the United States in 2024.
My
calculated total is larger than Gallup’s estimate by 1 million people.
@2x.jpeg)
The comparisons for my calculated total are essentially the same as they are for Gallup’s total.
Florida remains the state with the closest population.
From 2023-24, my calculated LGBT total surpassed the population of Florida.
My higher estimate for the number of LGBT US adults is larger than the population of Florida, but smaller than the population of Texas, just like Gallup’s.
My next article will be a Table of Contents for my three articles examining Gallup’s 2024 survey on LGBT identity in the United States.
This short series will be organized as Season 4 of LGBT by the Numbers, even though Season 3, which covers the results of a different survey, remains ongoing.
No comments:
Post a Comment