The percent of US adults who identify as Bisexual, Lesbian, and Transgender has increased, according to a new Gallup poll.
The percent of US adults who identify as gay has remained the same.
In 2023, Gallup surveyed more than 12,000 US adults over the phone.
Gallup asked respondents whether they identify as heterosexual, lesbian, gay, bisexual, transgender, or something else.
Overall, 7.6% of US adults identify with one or more LGBT groups.
Here are the
percent of US adults who identified with specific LGBT identities in 2023,
according to Gallup.
Identity US adults
Bisexual 4.4%
Gay 1.4%
Lesbian 1.2%
Transgender 0.9%
Gallup also
provided the percent of LGBT adults who identify with each specific identity.

Bisexual is by far the largest LGBT identity.
4.4% of US adults identify as bisexual.
A majority of LGBT US adults, 57.3%, identify as bisexual.
Bisexual identity among US adults in 2023 increased by 0.2%, compared to the year before.
Lesbian also increased by 0.2%.
Transgender increased by 0.3%.
The following table shows the percent of US adults who identified with specific LGBT identities in Gallup’s annual survey for the past four years.

I created a line graph, using Flourish, to illustrate this data.

The percent of US adults who identify as LGBT appears to track fairly well with the values for bisexual.
Here is a version of the graph that only shows specific LGBT identities.

As you can see, the order of identities remains consistent. Bisexual is always the largest, followed by Gay, Lesbian, and Transgender, in that order.
Volunteered Responses
Respondents to Gallup’s survey could volunteer responses other than Lesbian, Gay, Bisexual, or Transgender.
Gallup counted respondents who volunteered responses toward their LGBT total.
The most commonly volunteered responses were pansexual and asexual.
A total of 0.1% of US adults said they were pansexual, and 0.1% said they were asexual.
Bisexual and pansexual are near synonyms. They mean essentially the same thing.
These results do not, and cannot, indicate whether people are more likely to identify as bisexual or pansexual.
You can’t fairly compare the number of respondents who identify with a response listed in the question to a volunteered response that is not.
As I explained in my article on last year’s Gallup results, we still don’t know whether bisexual or pansexual is preferred by more people who identify with one or both of these terms.
Nonetheless, Gallup's volunteered responses do provide us with a new and interesting revelation.
The number of US adults who provide queer as a volunteered response has fallen off a cliff.
Queer can either be used as an umbrella term for LGBT or as a specific sexuality.
I examined the nuances of queer as an LGBT identity in “Thoughts on the Acronym.”
I explained the history of the word queer and its evolving meanings in “The Big Picture.”
As a volunteered response to Gallup’s LGBT question, it appears most likely that queer is being offered as a specific sexuality.
That is because three out of the four terms listed in Gallup’s question (lesbian, gay, and bisexual) are specific sexualities.
The numbers for volunteered responses are very small, but we can use the percent of LGBT adults who identify with a volunteered response to more easily compare these results from year to year.
About 0.1% of US adults submitted queer as a volunteered response in 2022.
About 0.01% of US adults did the same in 2023.
That is an order of magnitude difference.
The percent of US adults who provided queer as a volunteered response in 2022 was 11 times larger than it was in 2023.
Although we should be reluctant to conclude too much based on Gallup’s volunteered responses, it appears the number of people who identify with queer as a specific sexuality may have significantly declined.
Comparisons to Other Surveys
Gallup’s data on sexuality in the US in unmatched in terms of its quality.
Regarding gender identity, I prefer data from the Pew Research Center.
In 2022, a Pew survey determined 1.0% of US adults are nonbinary, and 0.6% of US adults are binary transgender.
I first discussed Pew’s survey in “Gender Identity in the United States.”
Using the results of a research study, I was able to determine 0.3% of US adults identified as asexual in 2020.
The study offered asexual as a potential response to its sexual orientation question.
I discussed that study in “Asexuality in the United States.”
Now let’s compare these values to the prevalence rates for sexualities from Gallup’s latest poll.
Identity US adults
Bisexual 4.4% (Gallup, 2023)
Gay 1.4% (Gallup, 2023)
Lesbian 1.2% (Gallup, 2023)
Nonbinary 1.0% (Pew, 2022)
Binary Trans 0.6% (Pew, 2022)
Asexual 0.3% (Research Study, 2020)
I created a bar graph, using Flourish, to compare these results.

Once again, we can see bisexual is far and away the largest LGBT identity.
In "Thoughts on the Acronym," I imagined what a long form of the acronym would look like if its letters were arranged by how common specific LGBT identities were among US adults.
Based on this new data, the order of those letters remains unchanged.
And we still don't know how many US adults identify as intersex.

Comparisons to US States
We can use Gallup’s data to calculate how many US adults identify as bisexual, gay, and lesbian.
About 11.5 million US adults are bisexual.
About 3.7 million US adults are gay.
And about 3.1 million US adults are lesbian.
Here is a graph showing the number of US adults who identify with specific LGBT identities.

We can then compare these numbers to the populations of US states and territories, as I first did in, “How many Americans are LGBT?”
Surveys generally don’t ask children and adolescents about their sexualities and gender identities, due to privacy concerns.
So keep in mind that the figures for LGBT identities represent US adults, whereas the populations for US states include all residents, regardless of age.
The number of US adults who are bisexual is closest to the population of Ohio, which is home to 11.8 million people.
Ohio is the seventh largest state by population.

The number of bisexual US adults has surpassed the population of Georgia. Previously, the number of bisexual US adults had been smaller than Georgia’s population.
The percent of US adults who identify as gay remains unchanged from 2022.
The number of US adults who are gay is closest to the population of Connecticut, which is home to 3.6 million people.
Connecticut is the 29th largest state by population.

The number of lesbian US adults is closest to the population of Nevada, which is home to 3.2 million people.
Nevada is the 32nd largest state by population.
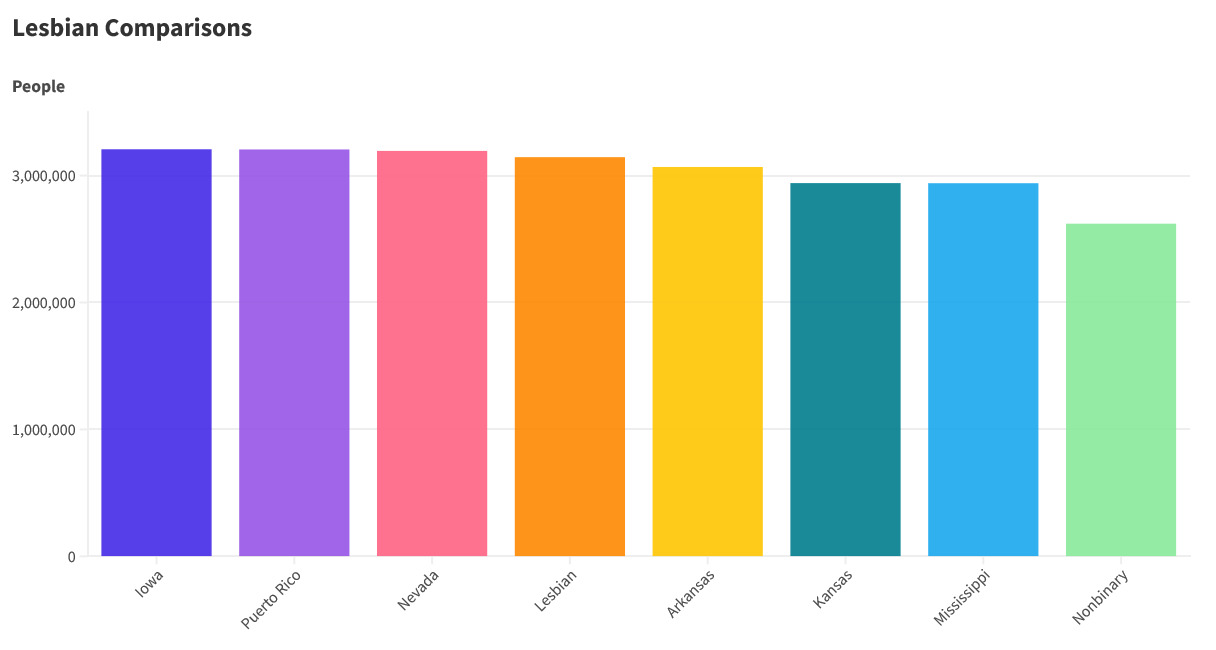
The number of US adults who are lesbian has surpassed the populations of Mississippi, Kansas, and Arkansas.
Previously, lesbian was tied with nonbinary, which appears on the right side of the graph.
In the next article,
we’ll take a closer look at LGBT identities among Gen Z adults and see how they compare to other generations.
No comments:
Post a Comment